Financial dashboard
One place for a group of companies' figures: drop in the accounting export and see straight away how each business and the group as a whole are doing, next to last year and the forecast.
- Apps
- Web design
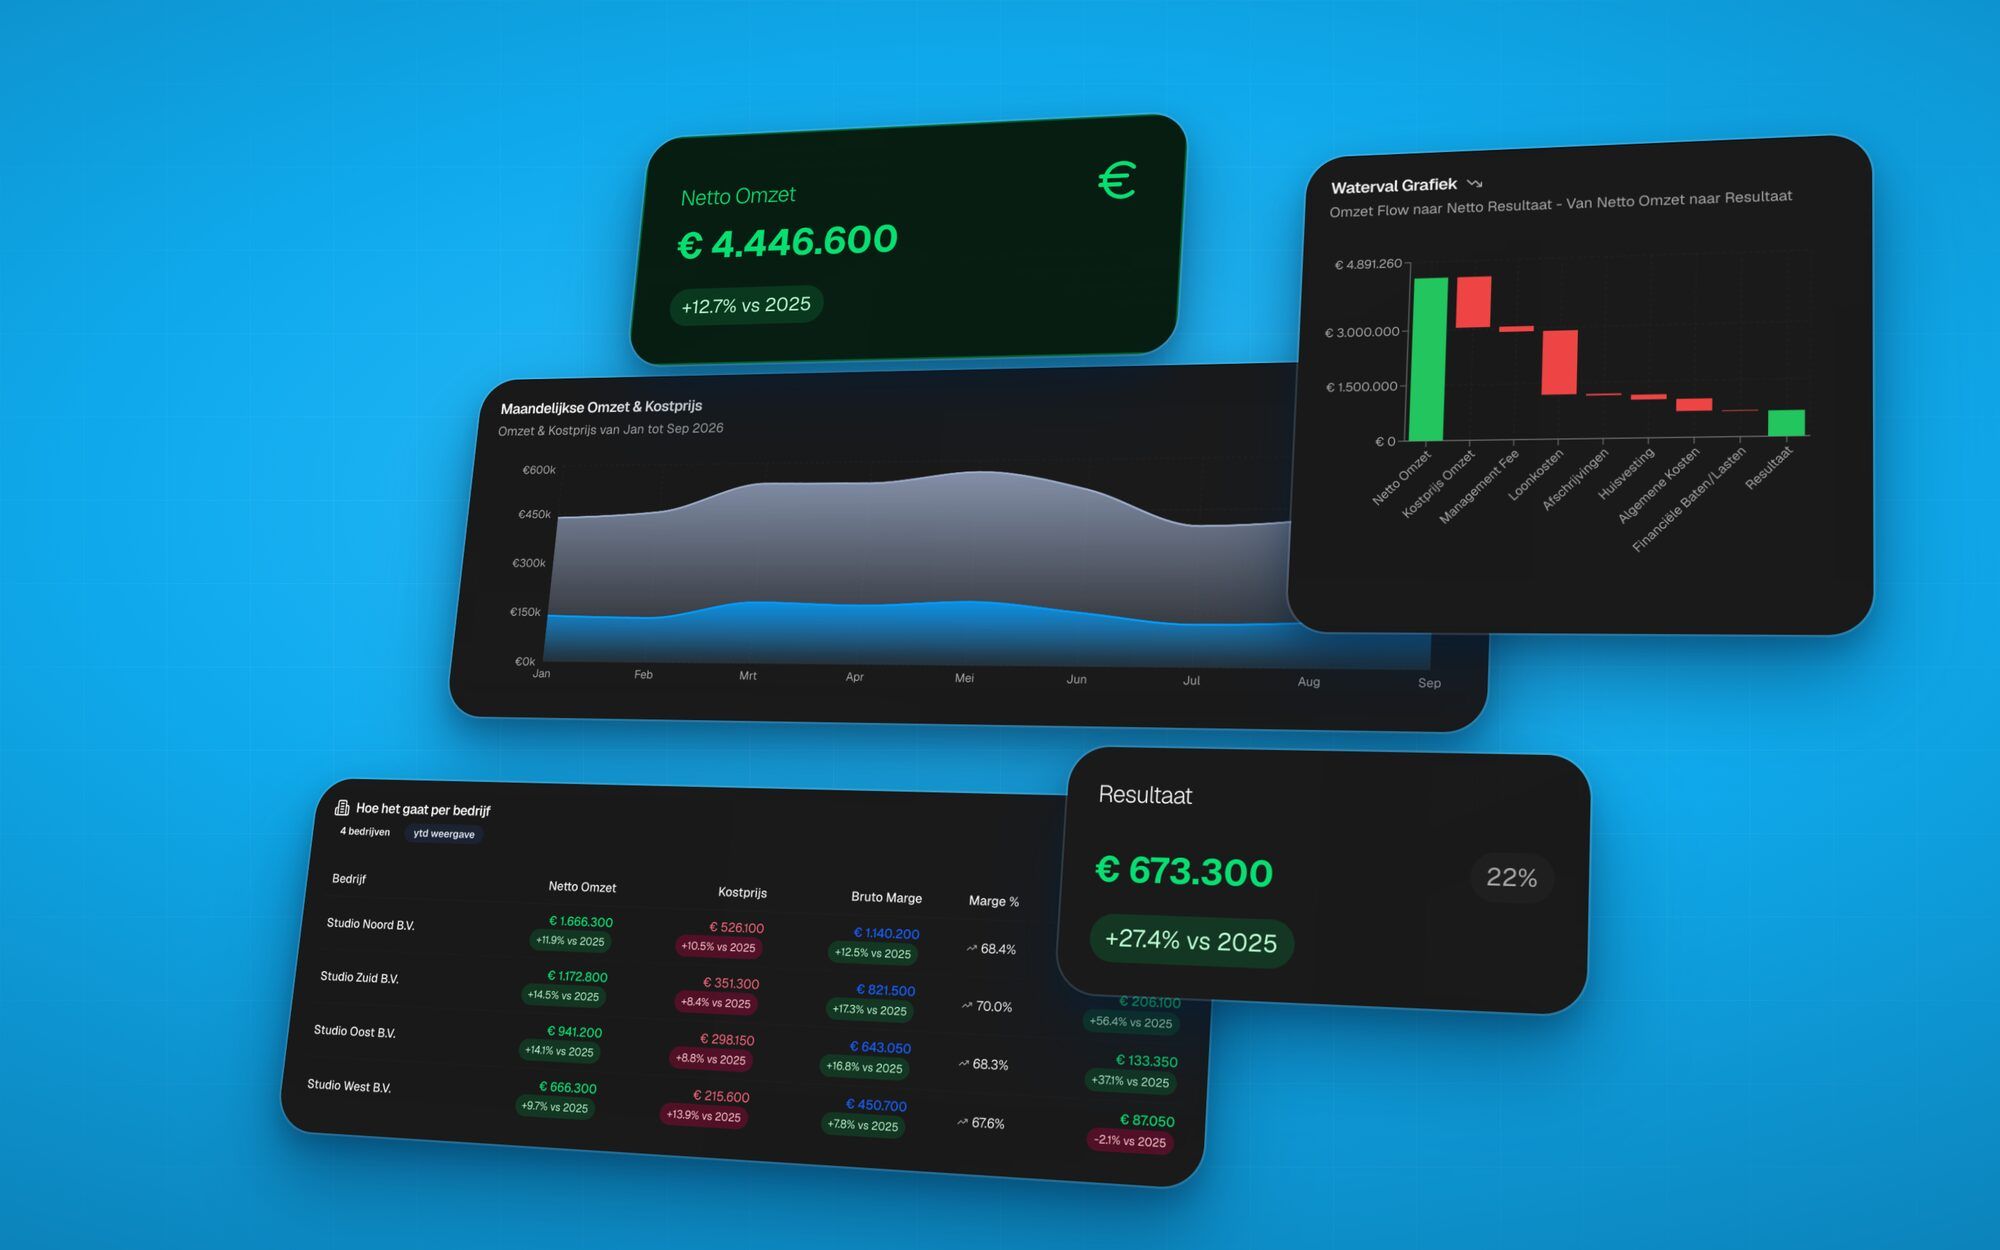
- drop the export, dashboard updated
- Excel in
- actuals next to plan, month by month
- Forecast
- and data separated per client
- 2FA
The brief
A group of several companies received each business's figures as separate Excel exports from the accounting software. Getting the full picture meant manual work: opening files, adding up, comparing with last year. Every month, all over again. The brief: one place where the board sees the figures for all companies together and for each one separately, by month, quarter or year, with last year and the forecast alongside. Without anyone in between keeping spreadsheets up to date. The images in this case show fictional demo data.
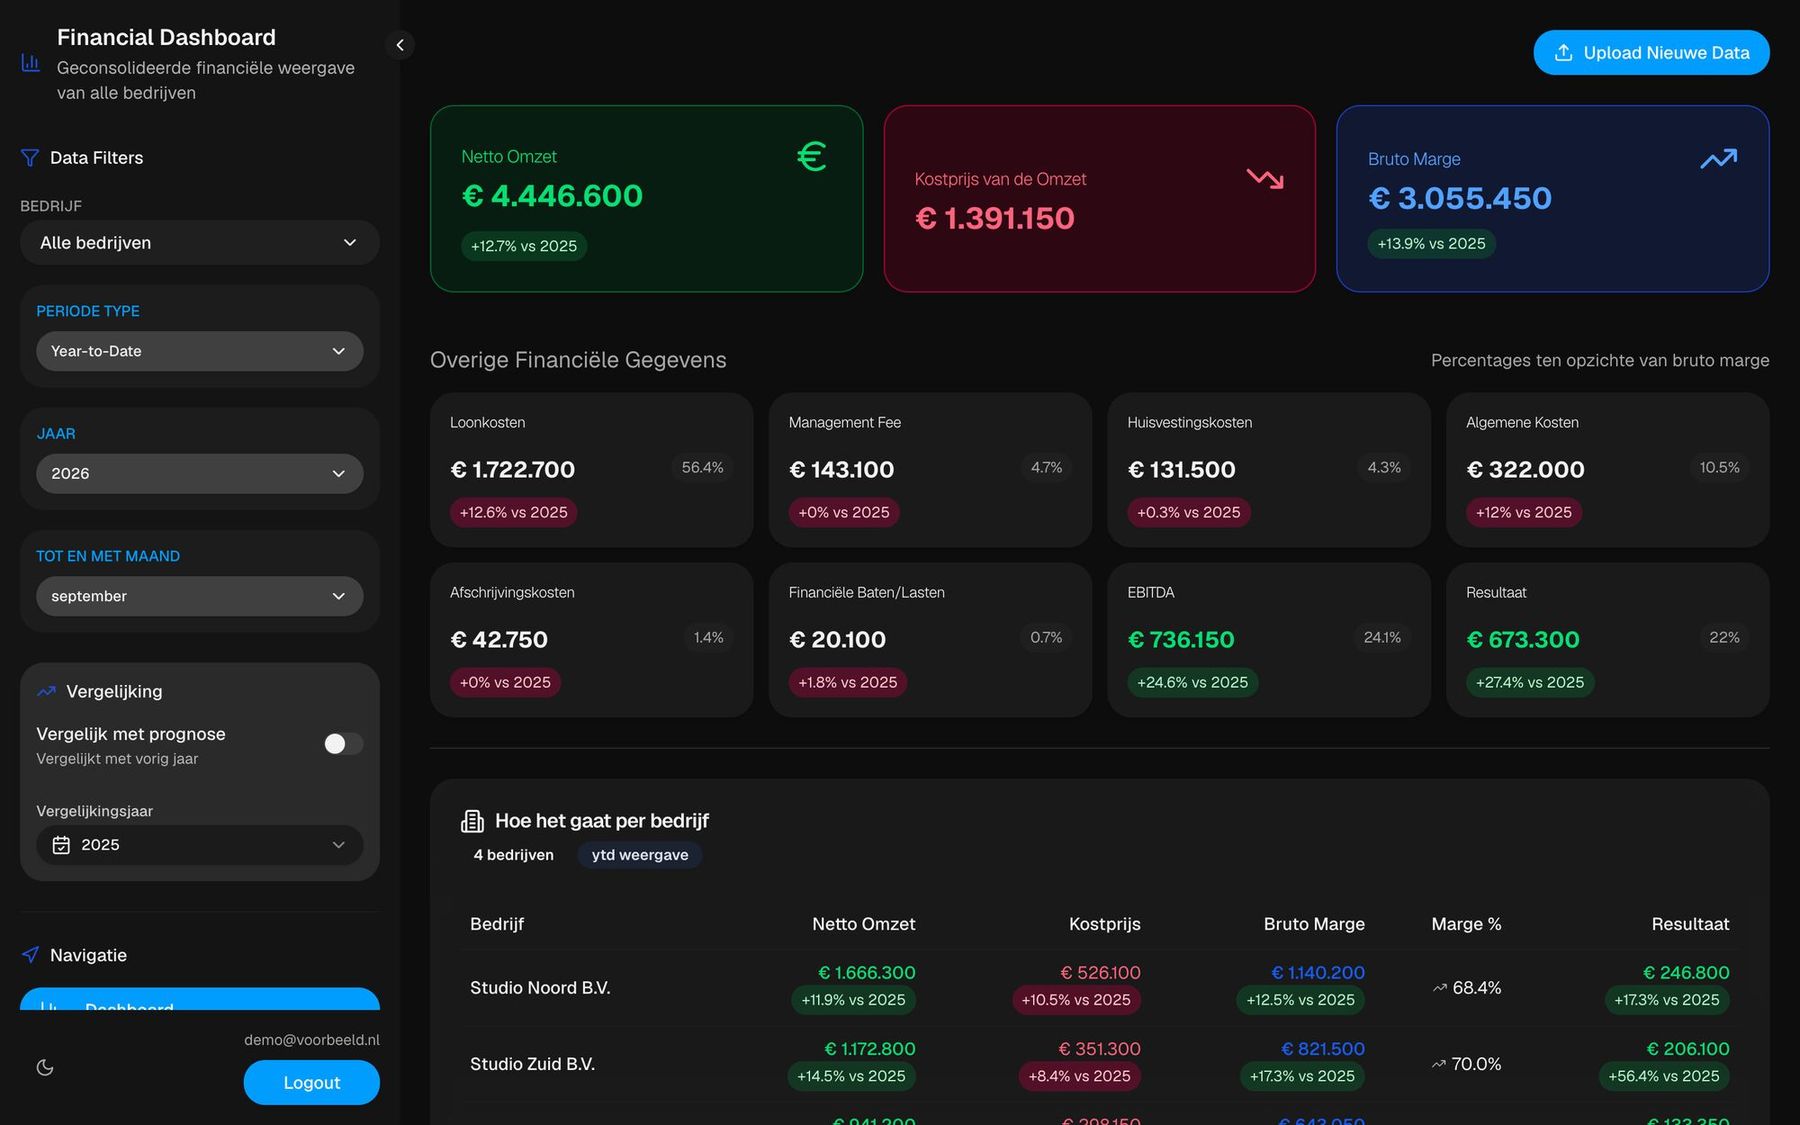
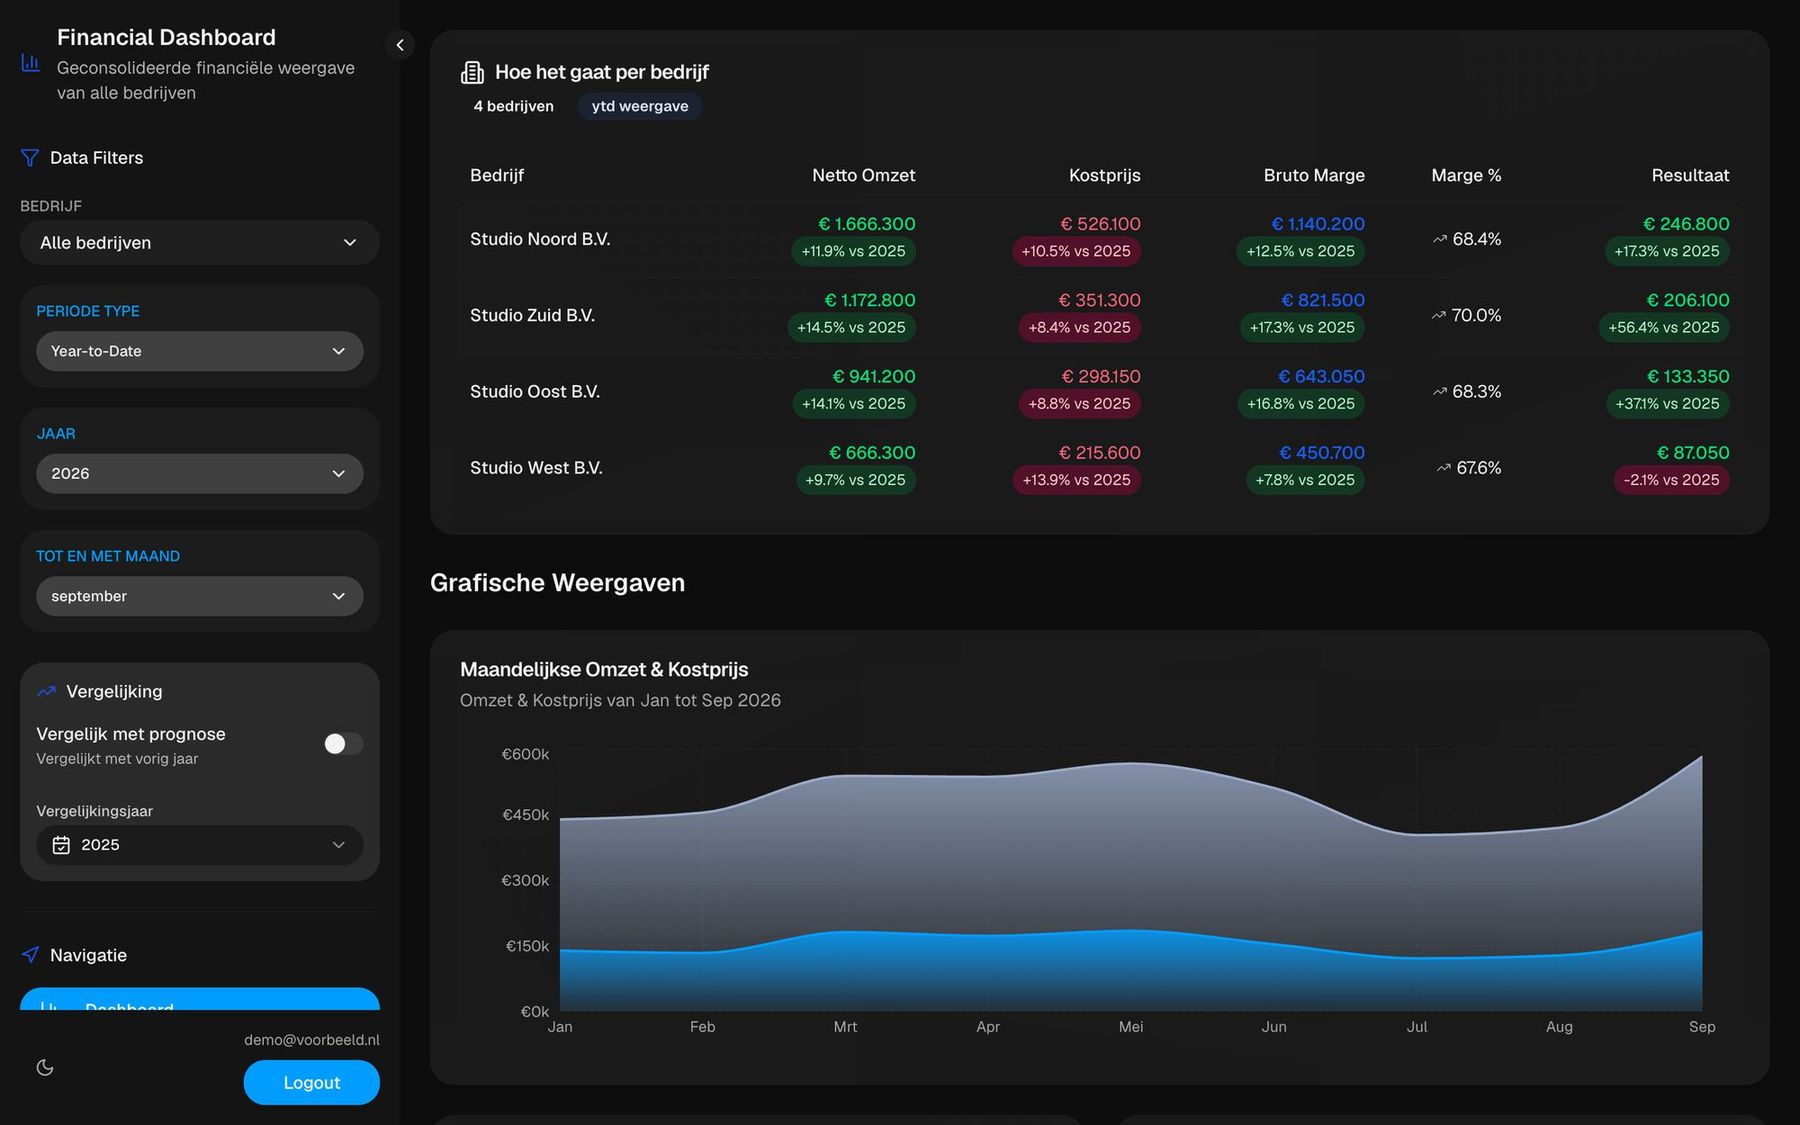
From accounting export to dashboard
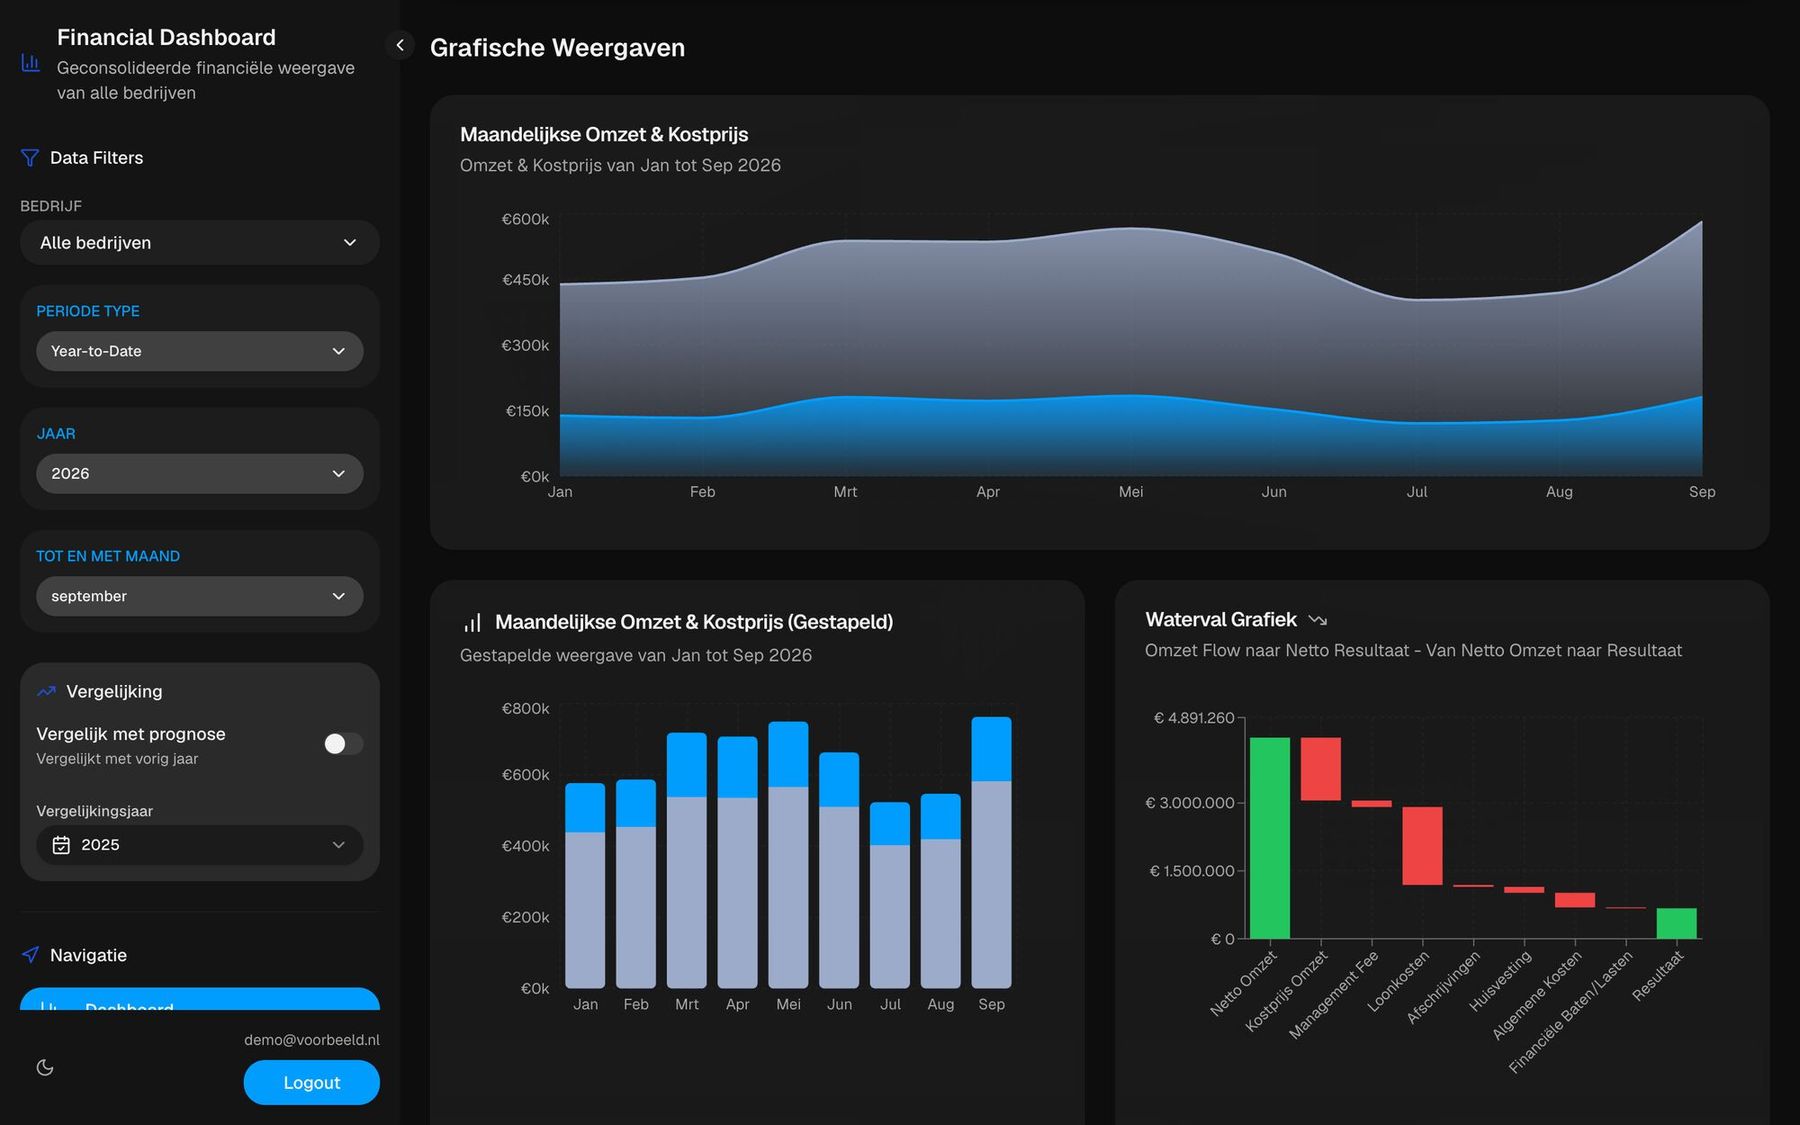
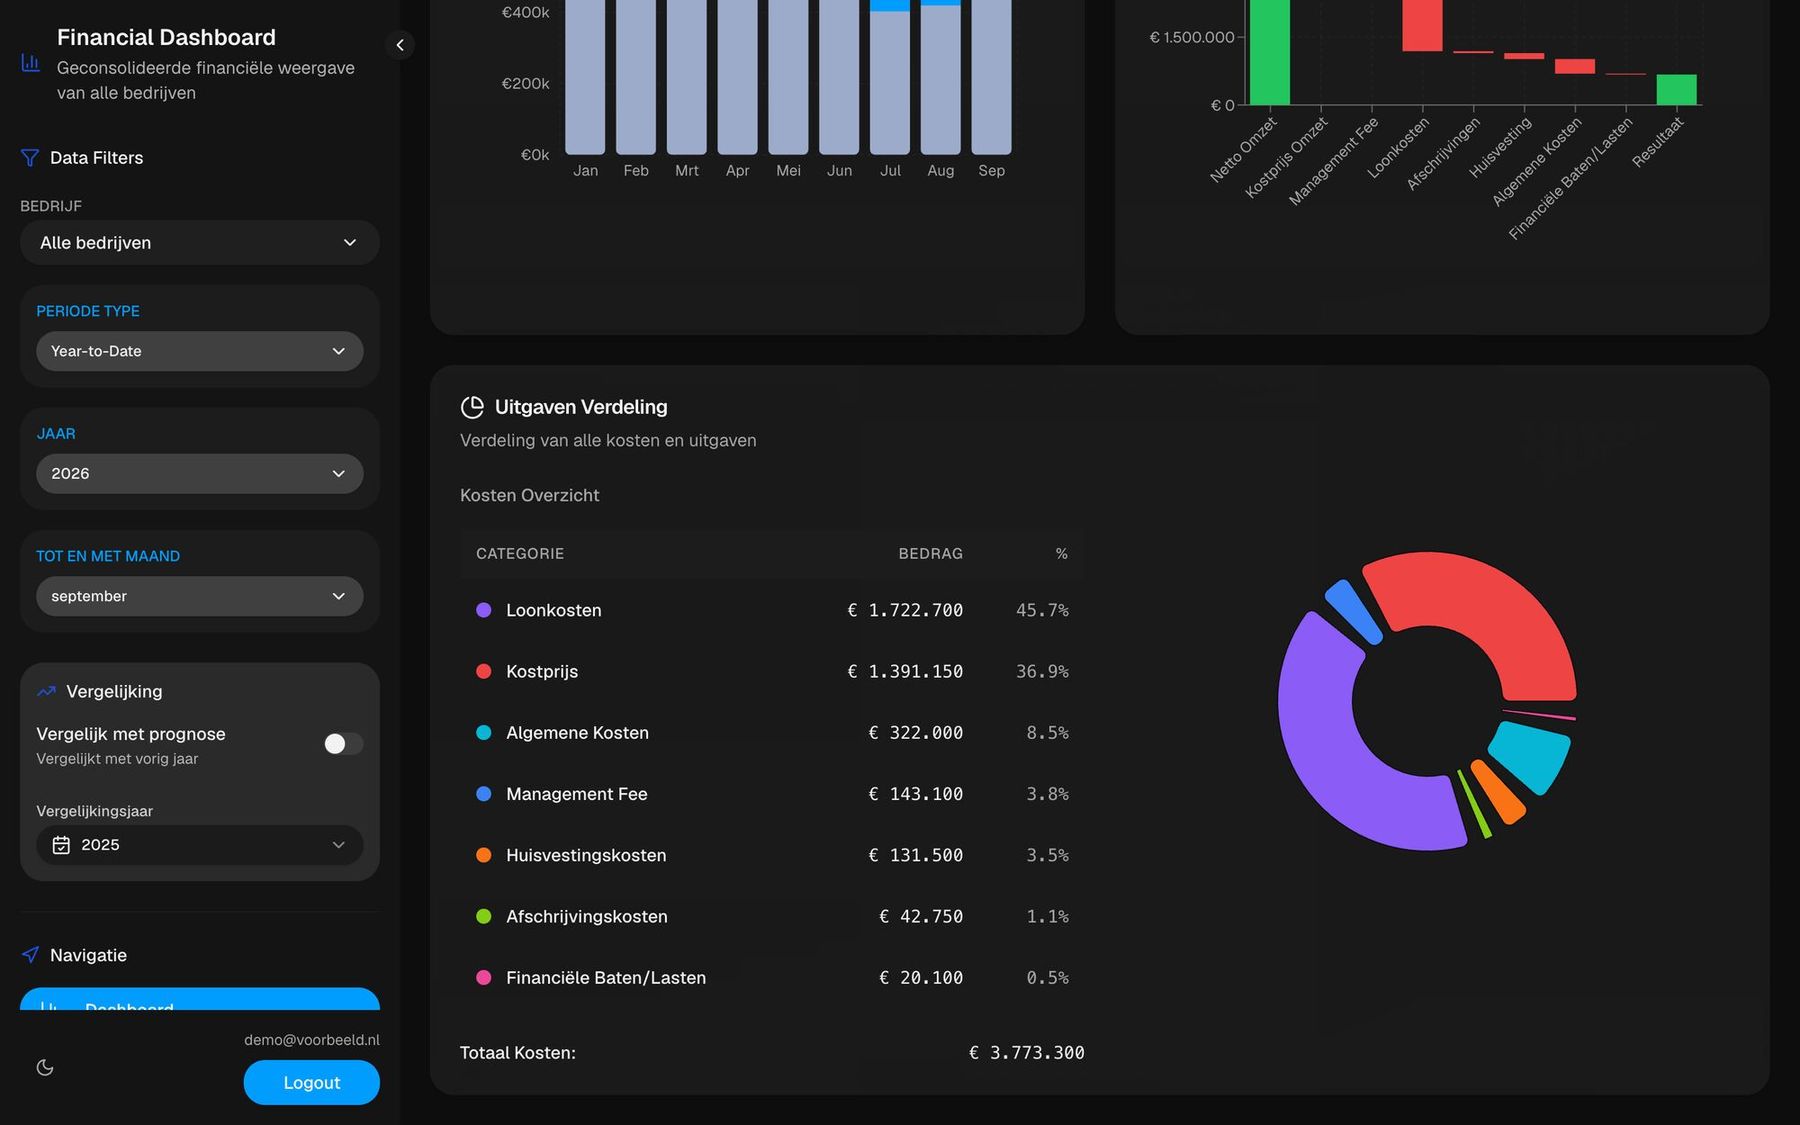
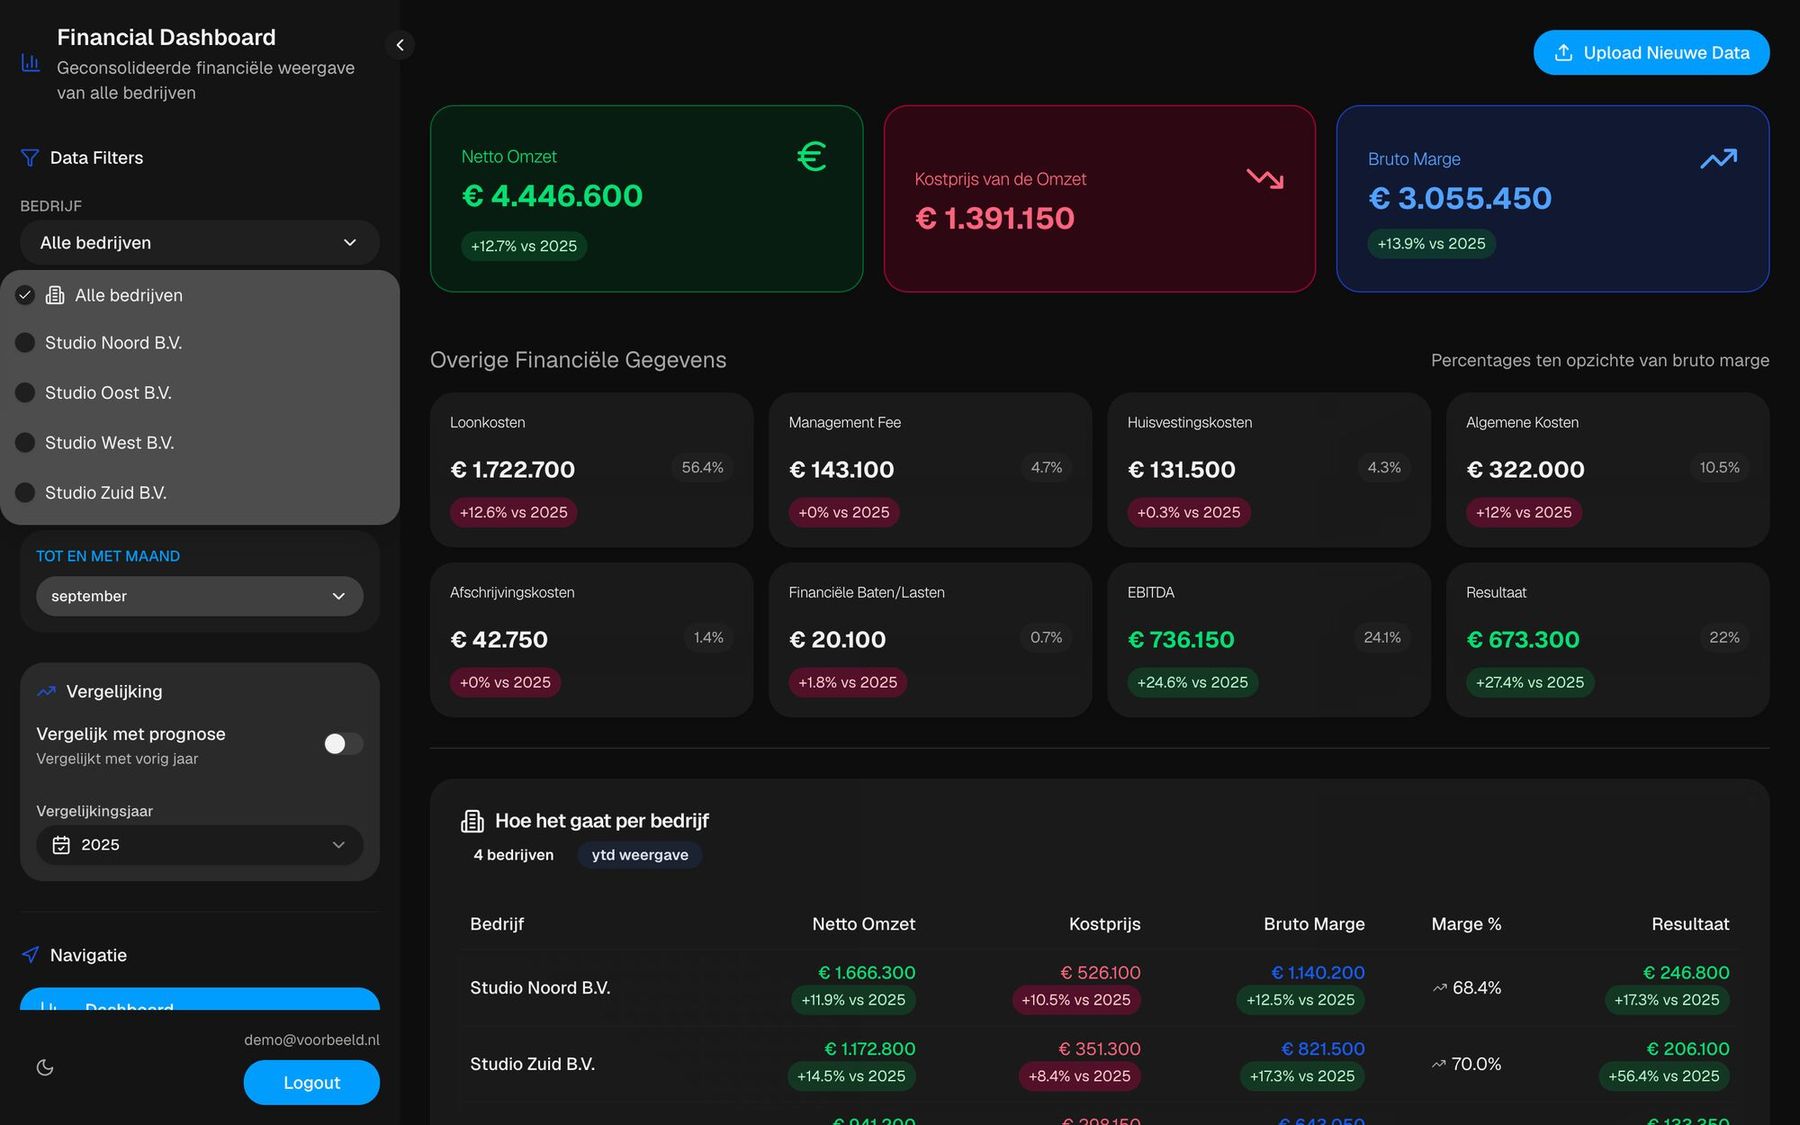
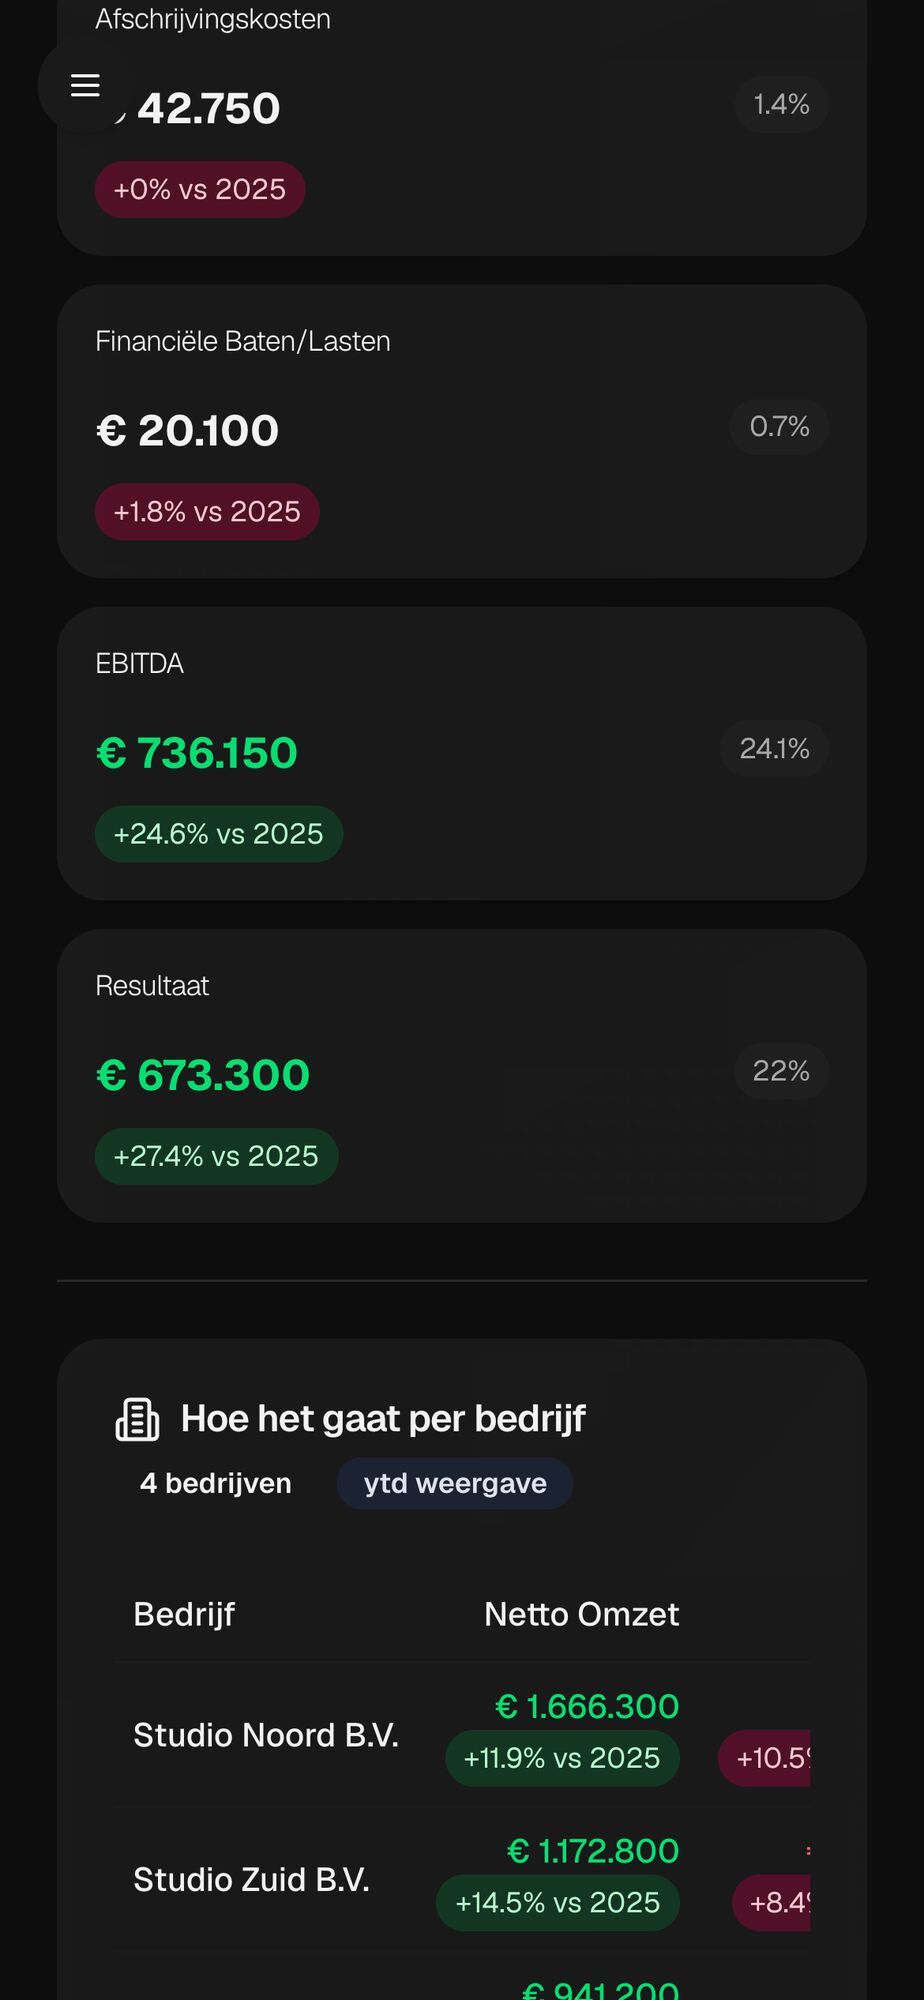
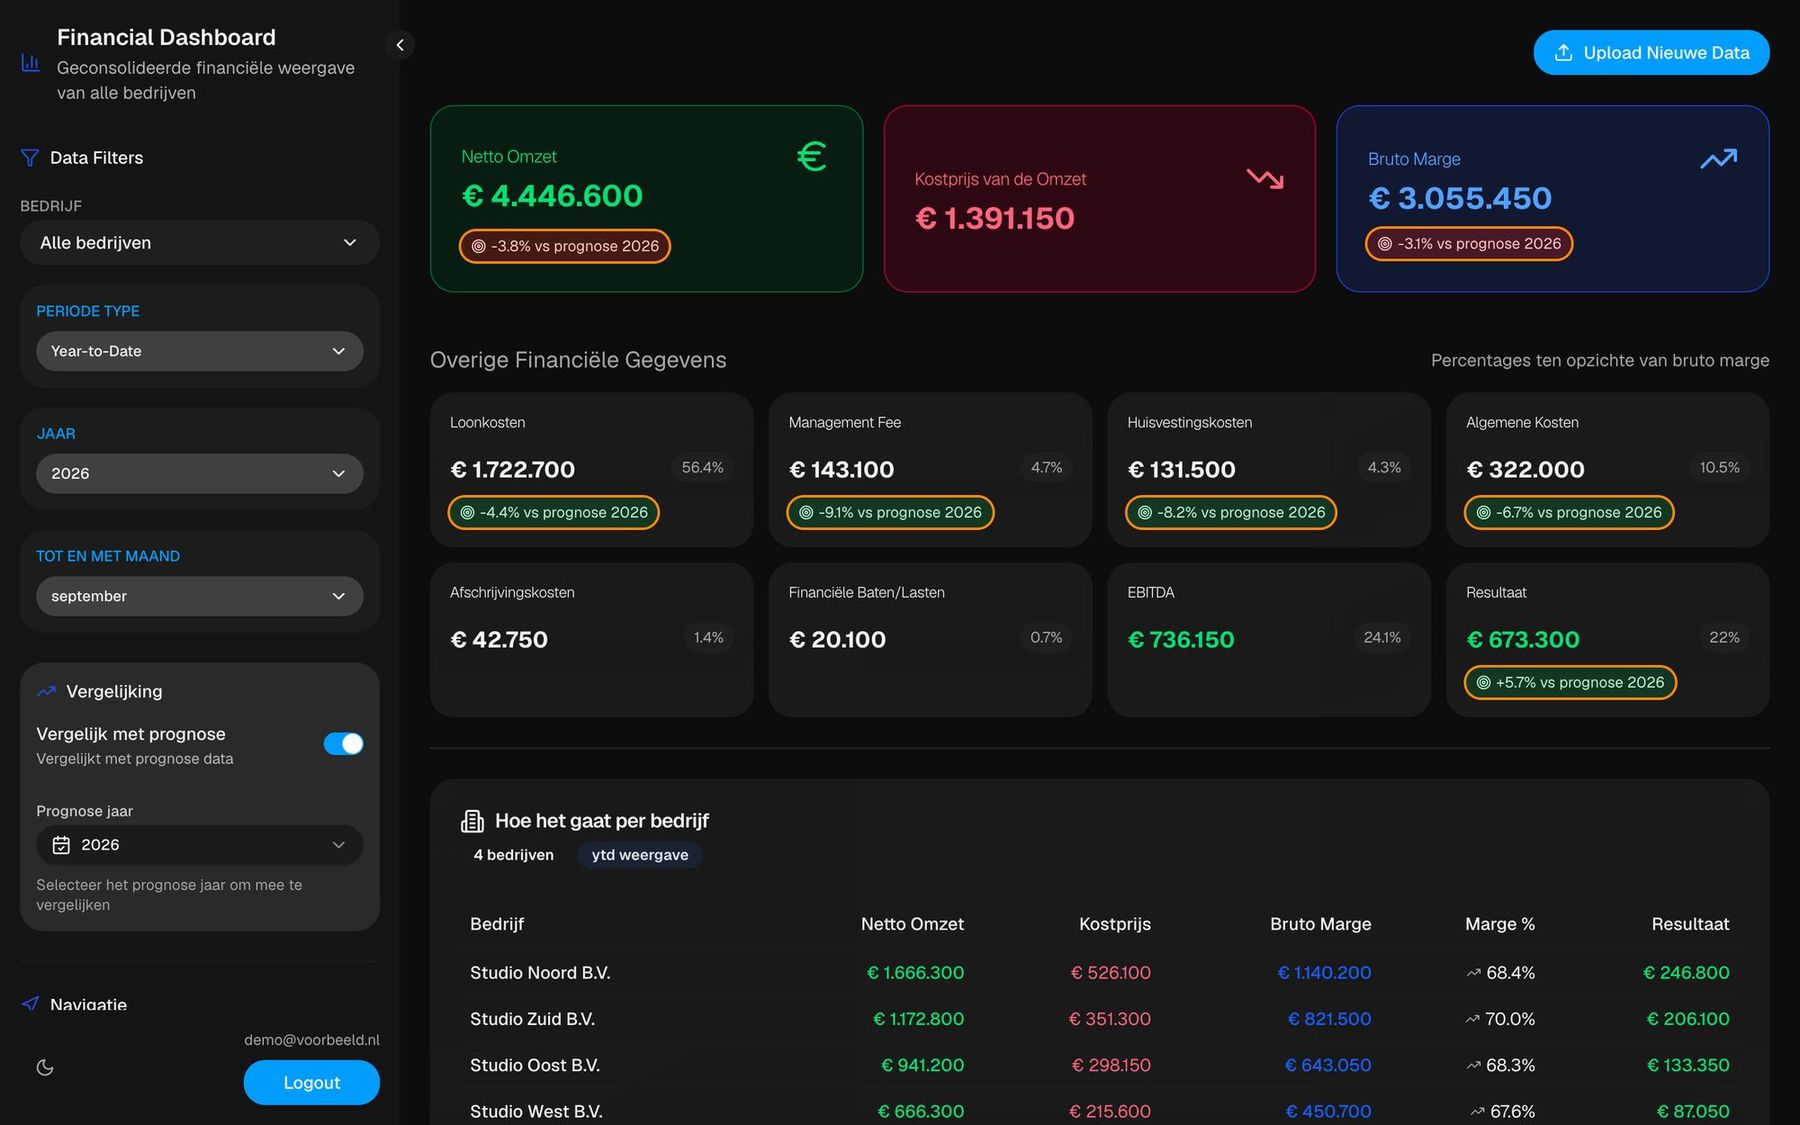
The export from the accounting package goes in with drag and drop. A parser recognises the company from the file name, reads Dutch number formatting and picks out the right lines: revenue, cost of sales, staff costs, premises, general expenses, depreciation. Each company has its own configuration, because no two sets of books are the same. At the top sit revenue, cost of sales and gross margin, with every cost line below as a share of the margin, plus EBITDA and net result. Charts show the monthly trend, a waterfall from revenue to result and how the costs break down.
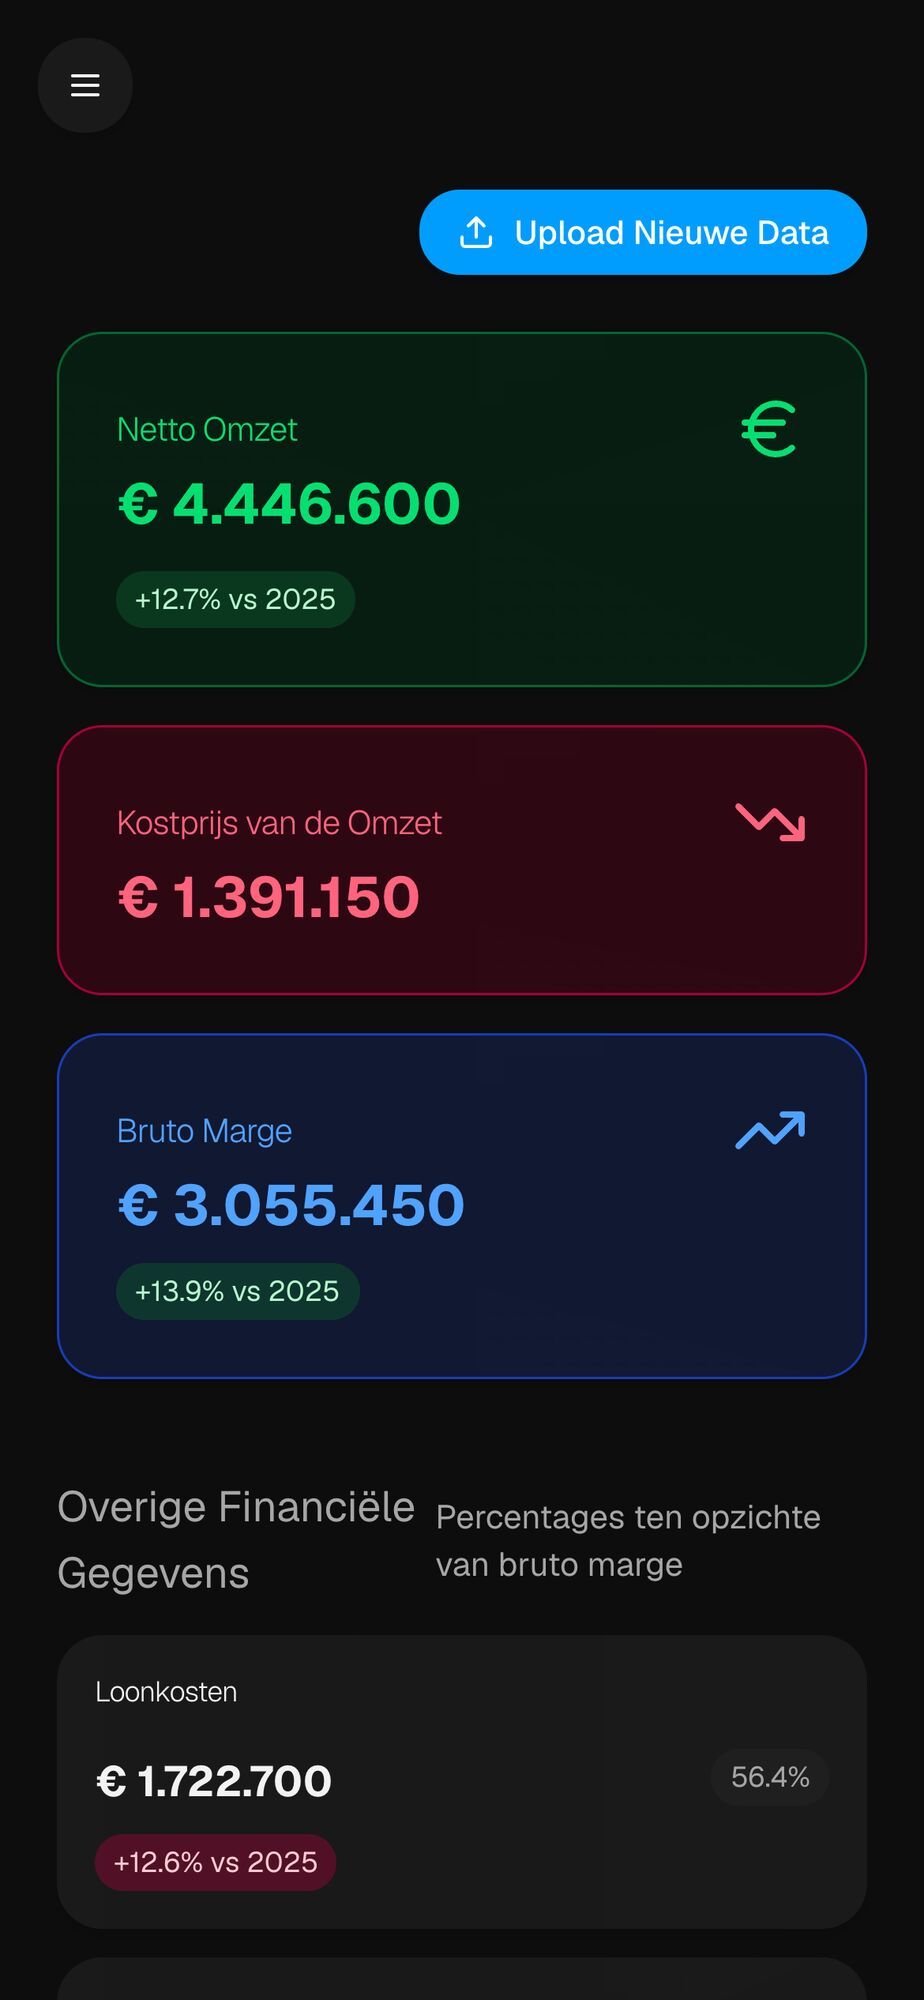
Detail one click away
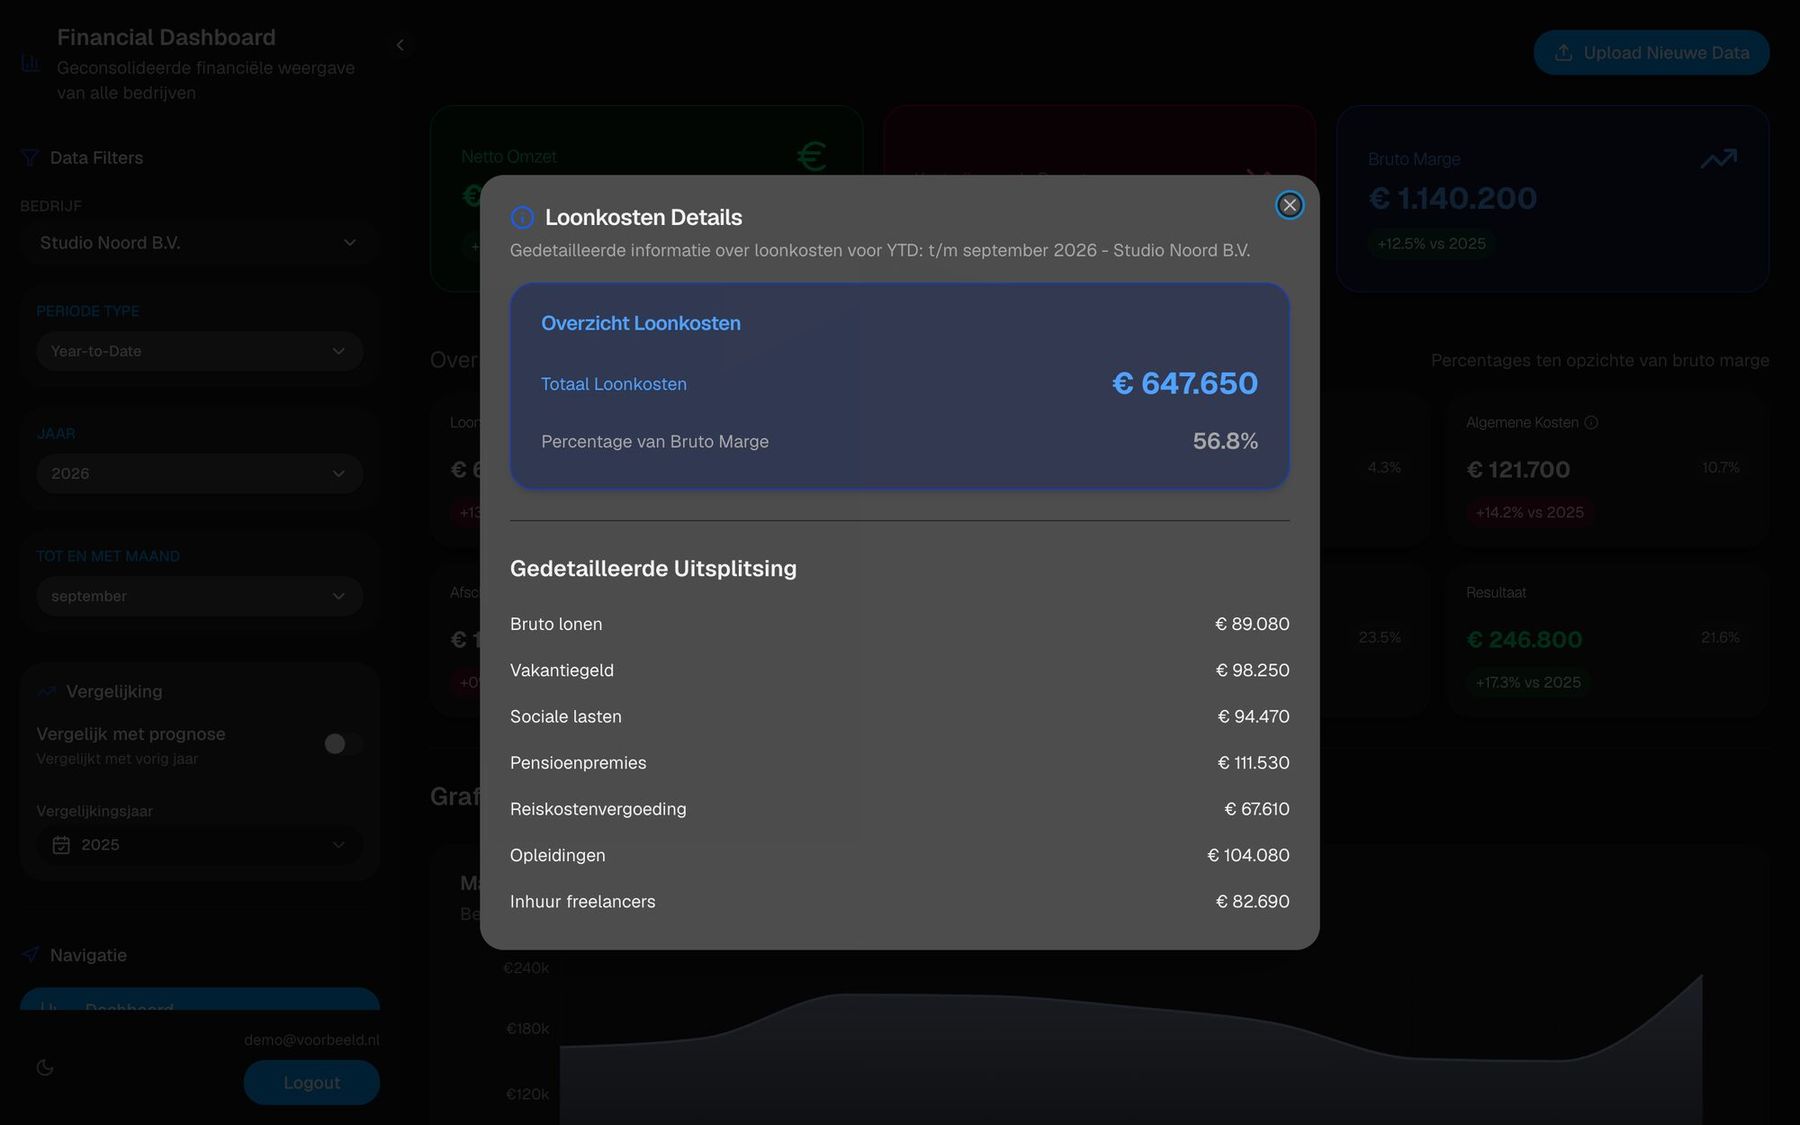
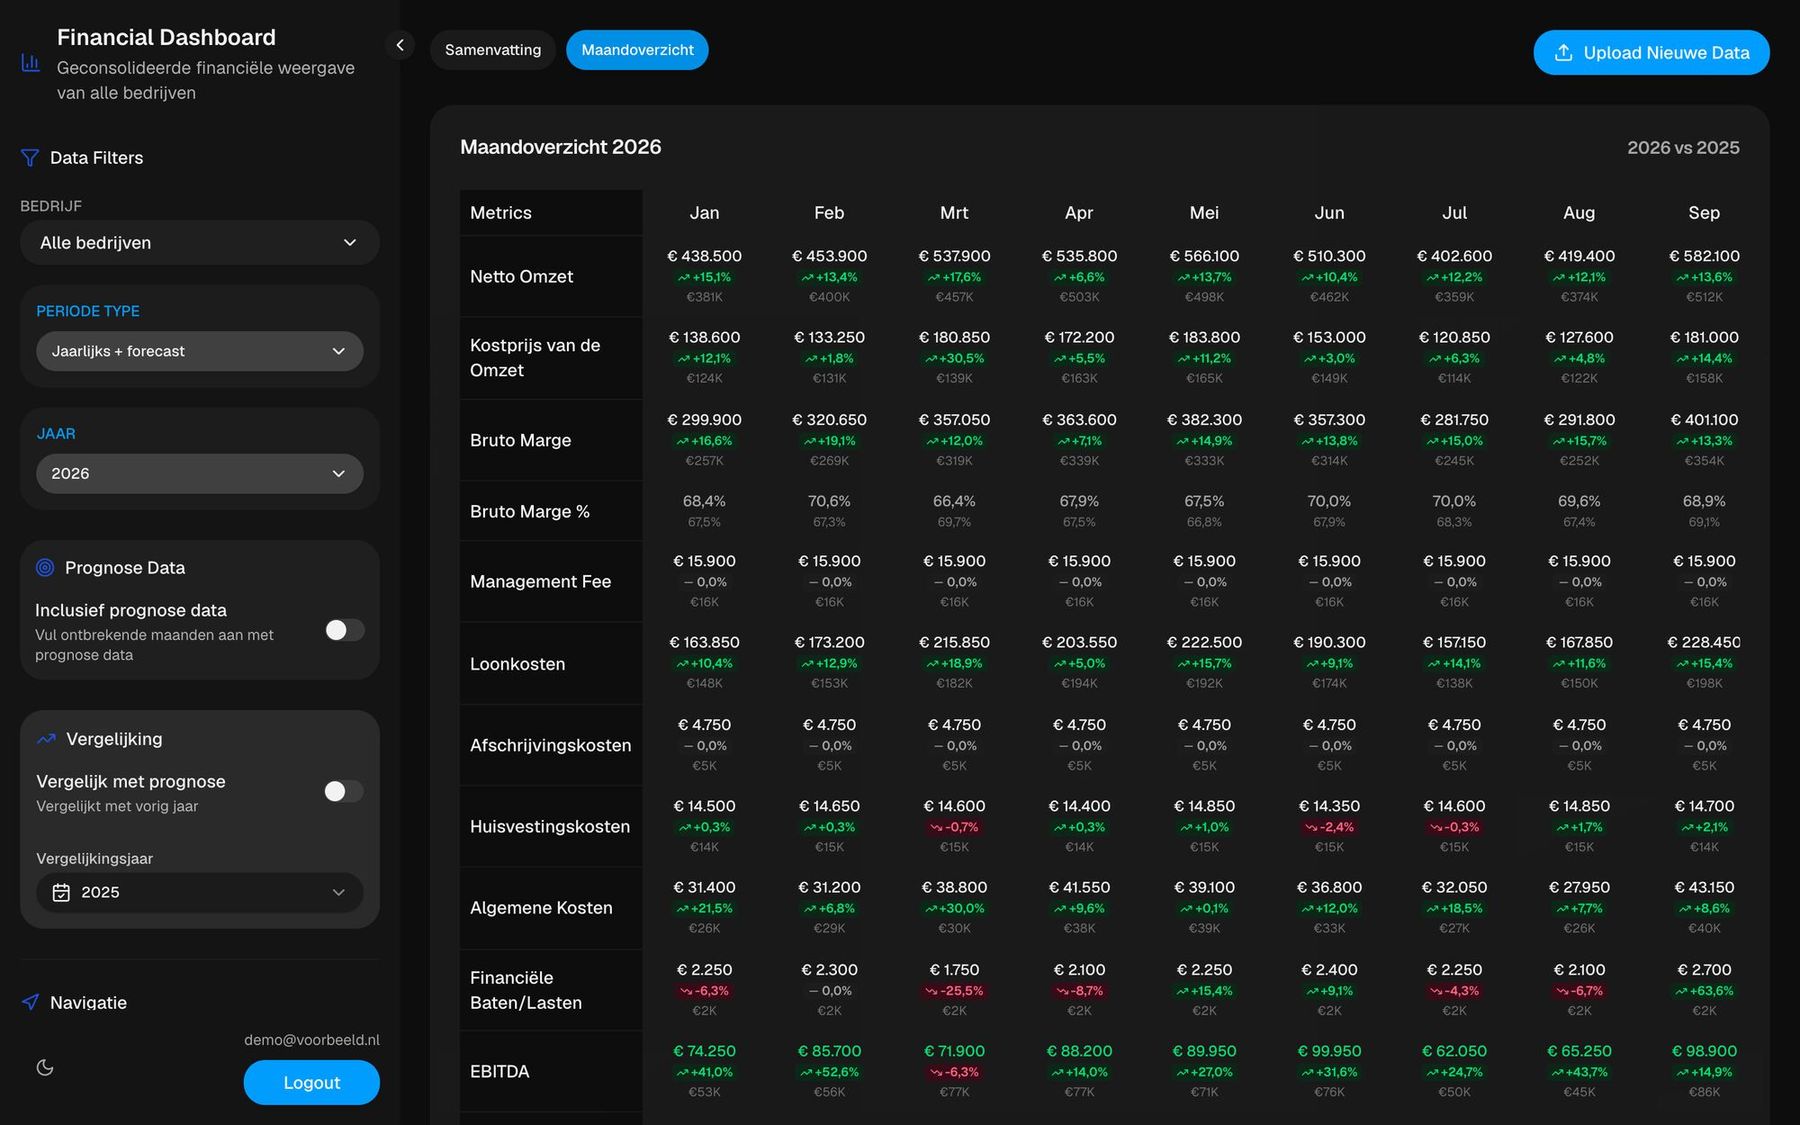
Pick one or more companies and everything recalculates. Click staff costs, premises or general expenses to see the ledger lines underneath. The annual view puts every month side by side, with gross margin as a percentage per month.
Looking ahead
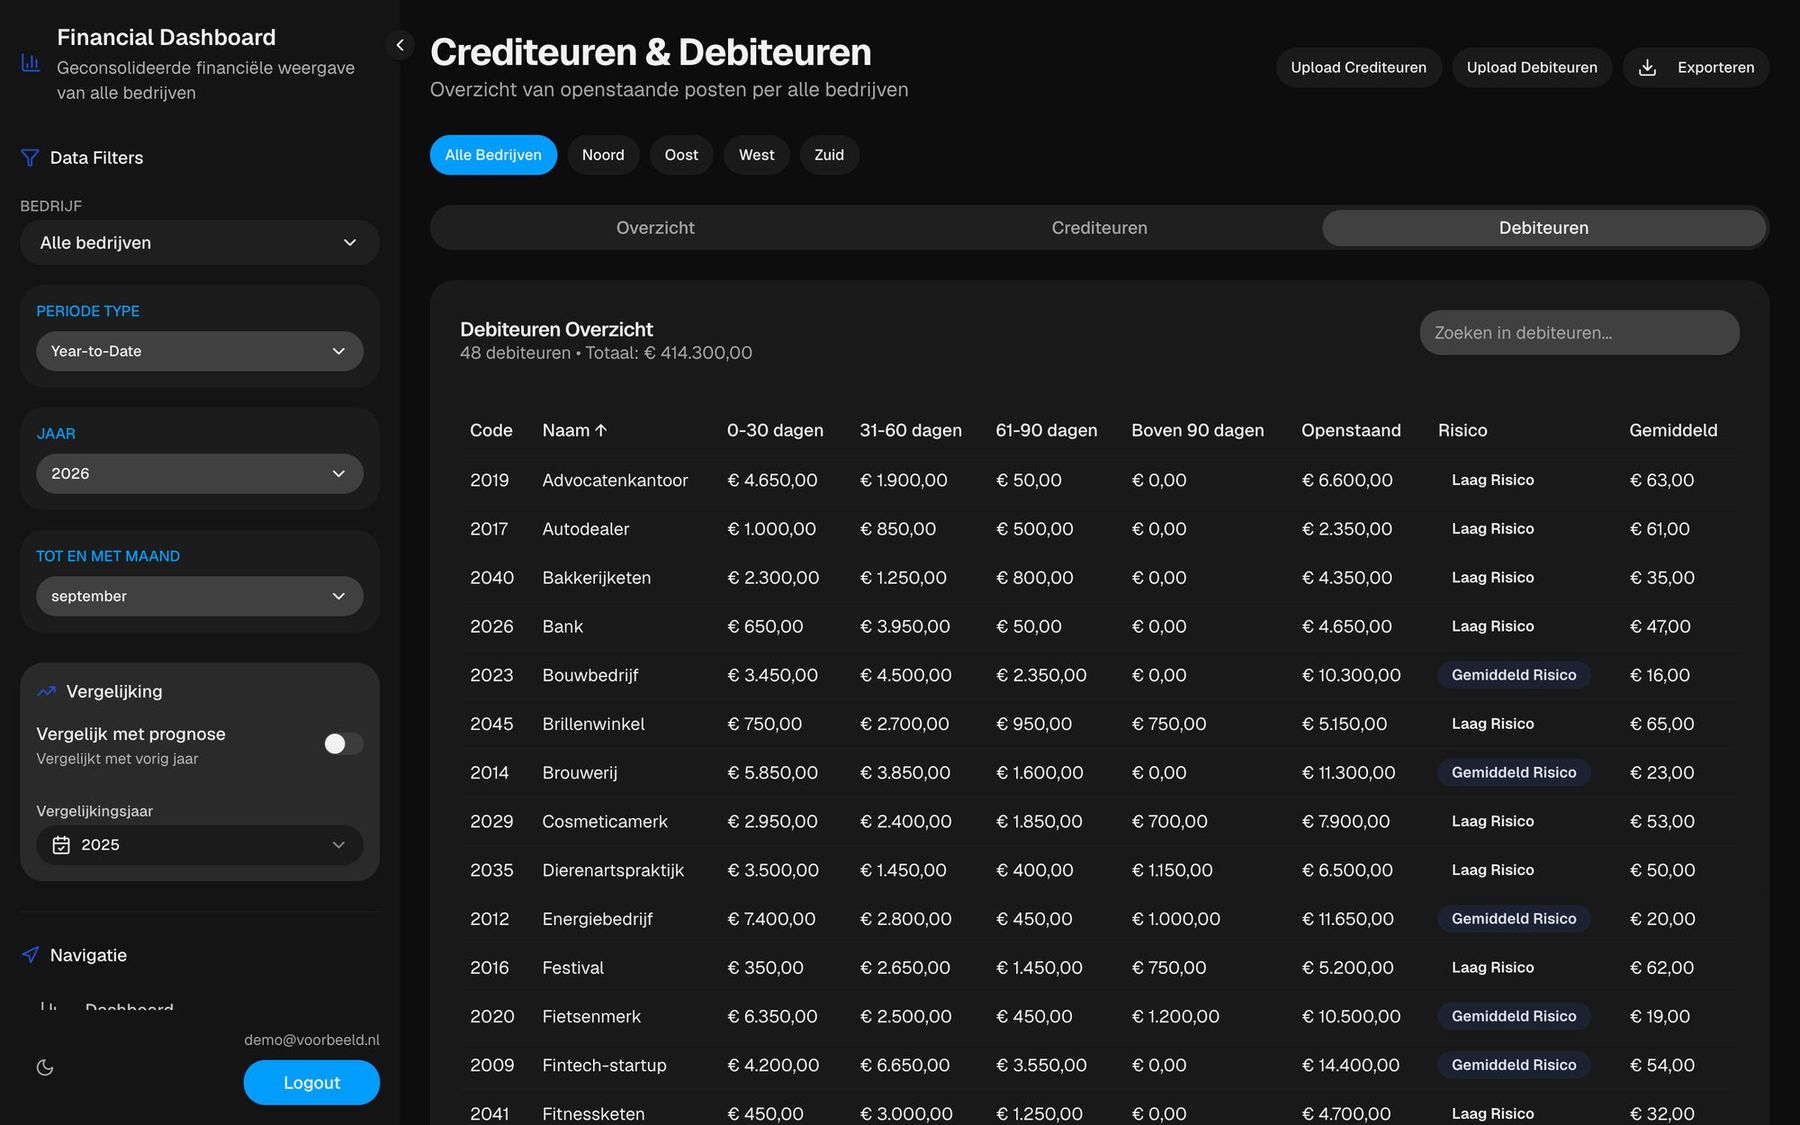
Every period can be compared with last year or with the forecast. Forecast figures fill in the months not yet booked, so the year is complete. Creditors and debtors get their own overview with ageing and risk per relationship. Signing in uses two-factor authentication. Row Level Security in the database ensures each user only sees their own organisation's companies.
Stack
Next.js 15 · React 19 · TypeScript · Tailwind · shadcn/ui · Recharts · Supabase (Postgres, Row Level Security, Auth with MFA) · SheetJS · Vercel
- Web design
- Websites
- Animation